How to Build a High-Intent Local SEO Prospect List from Google Maps Data

TL;DR: The Google Maps Local SEO Prospecting Playbook
Google Maps surfaces every signal you need to qualify a local SEO prospect before you spend a minute on manual research: star rating, review count, website presence, business hours, and category. The six-step system below turns that raw data into a tiered shortlist of 20–30 accounts with specific, named gaps you can pitch.
The six steps:
- Pick one niche and one metro where Maps drives the buying decision
- Pull structured listing data for that niche and city
- Clean, normalize, and tag the raw CSV
- Score and rank by a five-factor opportunity rubric
- Run a 5-minute micro-audit on every Tier 1 account
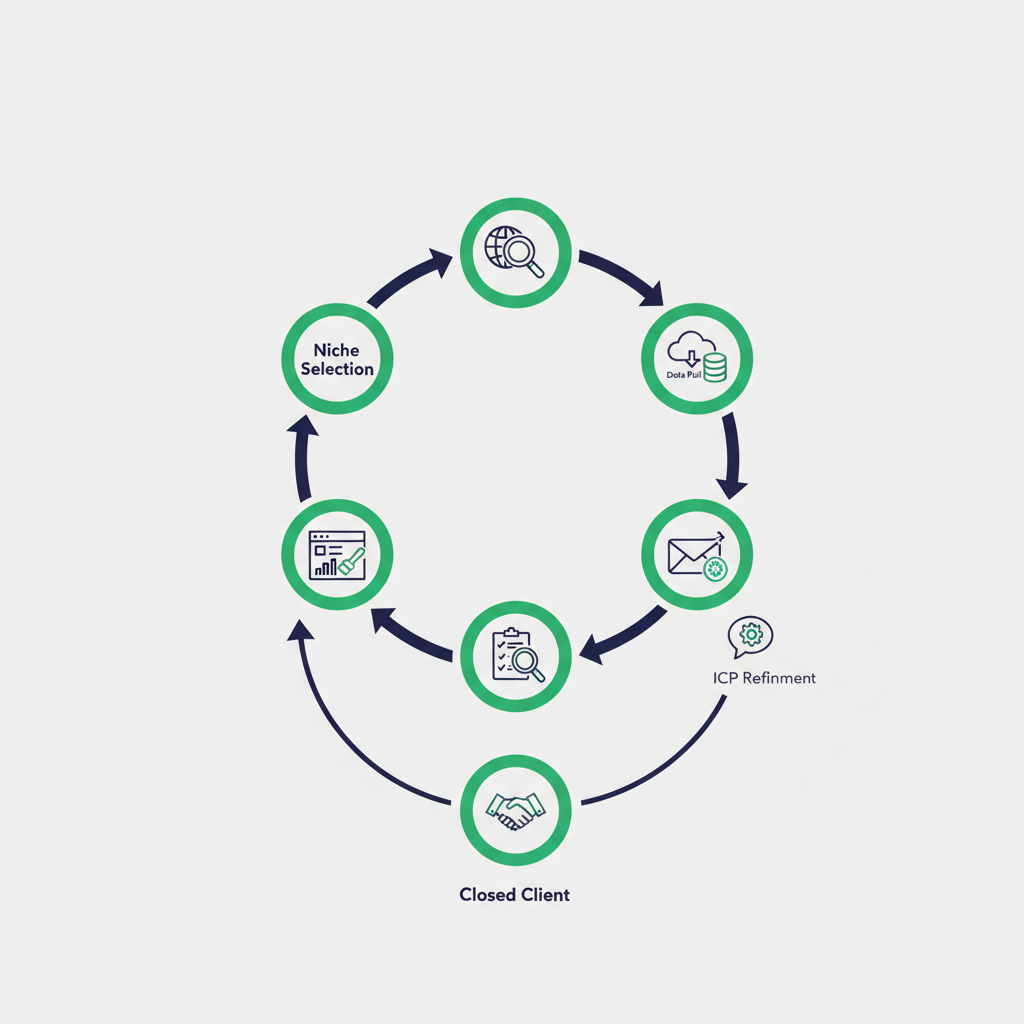
- Launch gap-led outreach and systematize wins into a repeatable ICP
Key signals to track: review count gap versus the local top-3 median, rating band (3.2–3.9 is the sweet spot), website presence tier, and GBP completeness. The output is not a long list; it is a short one you can actually work.
Why Google Maps Is the Best Prospecting Surface for Local SEO Agencies
For high-intent local categories (dentists, plumbers, HVAC contractors, roofers, med spas), the customer journey is short. Someone searches, glances at the local pack, picks the business with the most credible profile, and calls. According to BrightLocal’s Local Consumer Review Survey 2023, 98% of consumers used the internet to find a local business that year, and Google is the primary platform. The gap between a listing that wins that call and one that does not is visible, measurable, and fixable, which makes it a concrete revenue story you can tell in a cold email.
No other prospecting surface gives you this combination before you spend a minute on research: name, address, phone, website, star rating, review count, categories, and business hours, all structured, all comparable across competitors. LinkedIn tells you about companies. Google Maps tells you about customers.
The buying trigger: when local search ends in a phone call
Categories where Maps is the buying trigger share a pattern: the customer has an urgent, location-specific need and zero brand loyalty. They are not Googling “best dentist in America”; they are Googling “dentist open Saturday Dallas.” The local pack is the decision layer. A business that does not appear there, or appears with 9 reviews against a competitor’s 94, is losing calls it does not even know it is losing. That invisible revenue loss is your pitch.
Avoid categories where national brands or price-comparison aggregators dominate the funnel. A franchise location of a national dental chain rarely has a local owner who controls the marketing budget and feels the pain personally. Independent, owner-operated service businesses are your real buyers.
What Google Maps data reveals that no other source does
Rating, review count, website presence, and business hours are all visible before enrichment. You can qualify a prospect as high-priority or discard them as low-opportunity in under 30 seconds per row, with no email finder, no LinkedIn research, and no phone call required at this stage. That is the efficiency advantage.
Observed yields from city-level searches confirm the data density: a dentist search in New York City returns around 209 unique listings; nail salons return roughly 170; restaurants around 135. Dense categories in major metros produce 50–250 unique results per city search, more than enough raw material for a scored shortlist of 20–40 high-priority accounts.
Which niches and categories are worth targeting
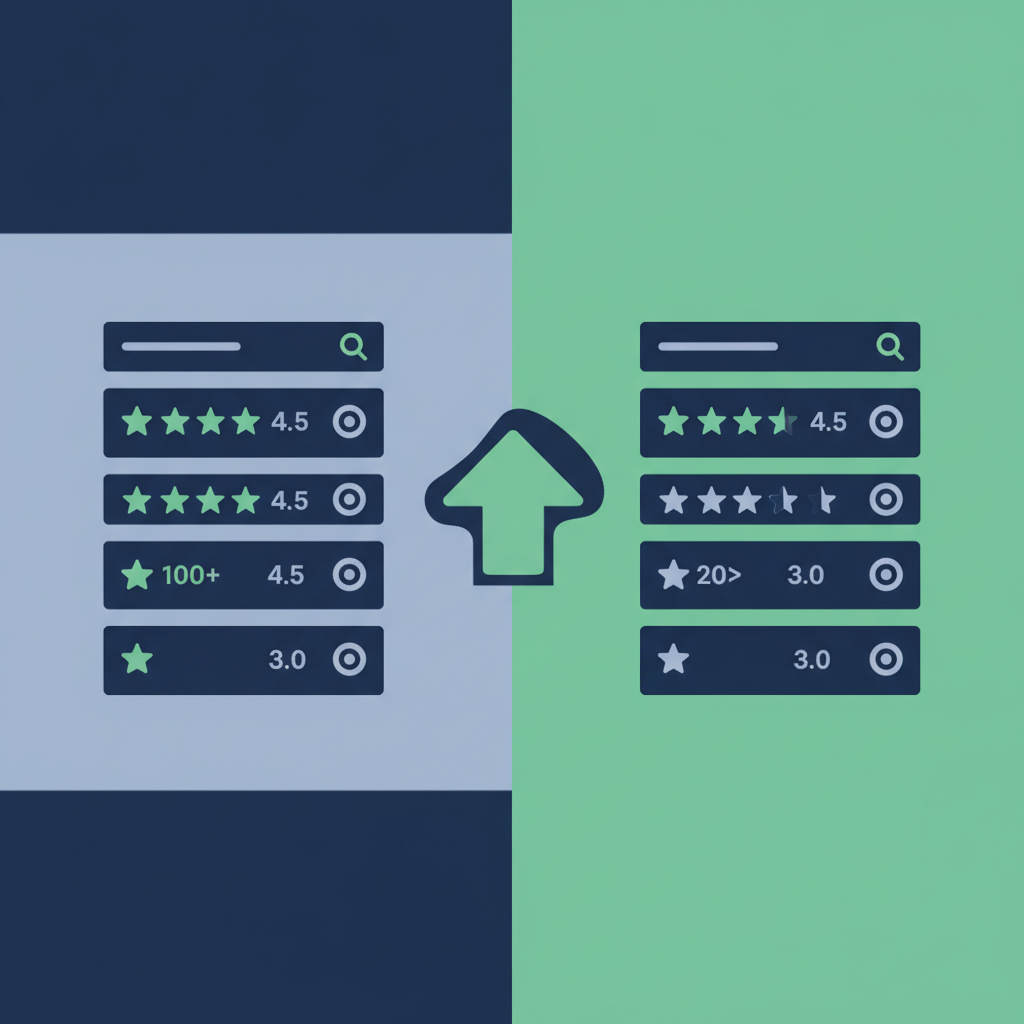
Validate a market before you commit to a prospecting sprint. Search “[category] [city]” in Google Maps and count how many of the first 20 results have fewer than 20 reviews. If the majority are review-thin, the market is under-optimized and worth entering. If most listings show 100+ reviews and 4.5+ stars, the category is mature and harder to crack; move to a different niche or a smaller metro.
Step 1: Pick One Niche and One Metro Area Per Prospecting Sprint
The single most common mistake in local SEO prospecting is scope creep at the start. “Texas dentists” is not a prospecting target. “Dallas dentists” is.
Here is why the narrowing matters: your scoring rubric depends on benchmarks (average review count for the top 3 competitors, typical Maps rank for the primary money keyword, what a “good” rating looks like in that category). Those benchmarks only hold within a single metro. A dentist with 40 reviews might be review-thin in Manhattan and review-rich in a small Texas city. If you mix markets, your scoring breaks down and your outreach loses specificity.
How to choose a niche where Maps drives the buying decision
The best niches for this approach share three traits: (1) the customer has an urgent, location-specific need, (2) the business is typically owner-operated with a single decision-maker, and (3) the average transaction value is high enough that one or two new clients per month justify an SEO retainer. Dentists, HVAC contractors, roofers, med spas, and personal injury attorneys all fit. E-commerce, SaaS, and categories dominated by national chains do not.
Also consider Maps rank leverage. According to Moz’s Local Search Ranking Factors research, the local 3-pack captures a disproportionate share of clicks on local search results pages , Sistrix data puts the click-through rate for the top local pack position above 24% on mobile, compared to single digits for positions outside the pack. Businesses in positions 4–20 are the most actionable targets: modest GBP and website improvements can move them into the 3-pack and produce measurable call volume increases.
Validating demand: the 20-review threshold test
Before you run a full data pull, spend five minutes on manual validation. Search your target category and city in Google Maps. Scan the first 20 results. If the majority have fewer than 20 reviews, you have found an under-optimized market. If most have 50+ reviews and 4.4+ stars, the category is mature. Move on or narrow the sub-category (“cosmetic dentist” instead of “dentist”).
One metro per sprint means your review-count benchmarks, competitor comparisons, and outreach references are internally consistent. You can say “the top-ranked dentist in Dallas has 94 reviews” and mean it. You can reference a specific competitor by name in a cold email. That specificity is what separates a reply-earning outreach from a deleted one.
For large metros, you may run the same category against several nearby cities (Dallas, Plano, Irving, Garland) and consolidate the results, but treat each city as its own benchmark pool, not one merged dataset.
Step 2: Pull Structured Google Maps Listing Data for Your Niche and City
Once you have validated the market, you need a structured dataset: not a list of URLs you manually copied from Maps, but a proper CSV with consistent fields across every listing.
What fields you need and why each one matters for scoring
The minimum field set for scoring is: business name, address, phone, website, star rating, review count, categories, and a direct Google Maps link. Each field does a specific job:
- Rating feeds your rating-band filter (3.2–3.9 = high upside; below 3.2 = reputation risk; 4.5+ = low need)
- Review count is the raw input for your review-gap calculation
- Website (populated or blank) is your first website-tier signal
- Categories lets you tag by sub-service for tailored messaging
- Phone (blank or present) is itself a GBP completeness signal
- Google Maps link is what you drop into a Loom or audit email
- Business hours flags accounts with incomplete or missing hours, another concrete GBP gap
- Price level helps you prioritize by likely transaction value
You also want GPS coordinates and a business ID if you are deduplicating across multiple city pulls.
Running searches by sub-category to segment messaging later
For niches with meaningful sub-categories, run each as a separate search. “Dentist,” “cosmetic dentist,” and “pediatric dentist” are different services with different patient concerns and different SEO gaps. If you lump them together, your outreach defaults to generic “local SEO” language. If you keep them separate, your email to a pediatric dentist can reference their specific category, their specific competitor, and their specific gap, and it reads like you did your homework.
The same logic applies to HVAC (“HVAC contractor” vs. “furnace repair” vs. “AC installation”), legal (“personal injury attorney” vs. “car accident lawyer”), and most other service niches with meaningful sub-specialties.
Covering a large metro: multi-city runs and the Location Searched column
For a metro like Dallas-Fort Worth, running a single “Dallas” search will miss businesses based in Plano, Irving, Garland, or Arlington. Run the same category against each major city in the metro, then consolidate the CSVs in a spreadsheet. Deduplicate on Business ID; the same business can appear in adjacent city searches if it is near a city boundary.
The manual path: open Google Maps, search your category and city, scroll through results, and copy each listing’s name, address, phone, website, rating, and review count into a spreadsheet row by row. For 150 listings across four cities, that is 3–5 hours of copy-paste work before you have scored a single prospect.
The faster path: gtme.business lets you select a business category and a city, runs the search against Google Maps data, and exports a 15-column CSV (name, address, phone, website, rating, review count, categories, GPS coordinates, timezone, business hours, price level, business ID, a “Location Searched” column, and a direct Google Maps link). One search covers one city; covering four sub-categories across four nearby cities costs 16 searches (4 categories × 4 cities). At the Starter plan ($35/month for 30,000 searches), the data-pull cost for a full metro sprint is effectively zero. You get up to a few hundred unique listings per city search (often 50–250; up to around 500 in the densest cases) after proximity filtering and deduplication: a focused sample, not a city-wide census, but more than enough raw material for a scored shortlist.
The “Location Searched” column tracks which city each listing came from, so when you consolidate multiple city CSVs, you can see at a glance whether a business appeared in your Dallas pull or your Plano pull. Deduplicate on Business ID before scoring.
Try gtme.business free with 20 searches, no credit card required.
Step 3: Clean, Normalize, and Tag the Raw CSV Before Scoring
Raw data from any source (manual or tool-assisted) needs cleaning before it is useful for scoring. Skipping this step means your opportunity score reflects data noise, not real signal. Budget roughly 2 minutes per row for a combined clean-and-tag pass on a well-structured CSV.
Phone normalization and the blank-phone signal
Standardize all phone numbers to E.164 format (+12145550123) in a new column. Most dialers and CRMs require consistent formatting to ingest without errors. Flag any rows where the phone field is blank: a missing phone number on a Google Maps listing is itself a GBP completeness gap, and it is one of the easiest fixes you can promise in outreach.
Also flag rows where the same phone number appears more than twice. This is a reliable chain or franchise indicator; those accounts rarely have a local owner who controls the marketing budget.
Adding a has_website boolean and stripping domains for research
Add two columns: has_website (1 if the Website field is populated, 0 if blank) and website_domain (the domain stripped of protocol and trailing slashes: example.com not https://example.com/). The boolean makes filtering instant; the clean domain makes downstream research faster when you are checking PageSpeed scores or looking up the site’s About page.
Remove or flag rows where the website domain is a major franchise or aggregator (for example, a Yelp listing mistakenly appearing in the website field, or a corporate parent domain shared across dozens of locations). These are false positives.
Tagging by sub-service so outreach mirrors their language
Add a sub_service tag based on the Categories field. For a dentist dataset, that might be: “general dentistry,” “orthodontics,” “oral surgery,” “pediatric dentistry,” or “cosmetic dentistry.” For HVAC: “installation,” “repair,” “maintenance.”
This tag does one job: it lets you write outreach copy that mirrors their own service language rather than defaulting to “local SEO services.” A cosmetic dentist does not think of themselves as a dentist who needs SEO. They think of themselves as a cosmetic dentist who needs more patients looking for veneers and whitening. Match their frame.
Also remove any remaining chains and multi-location brands by flagging rows where the business name contains known franchise indicators or where the same website domain appears across more than two rows.
Step 4: Score and Rank Prospects Using a Five-Factor Opportunity Rubric
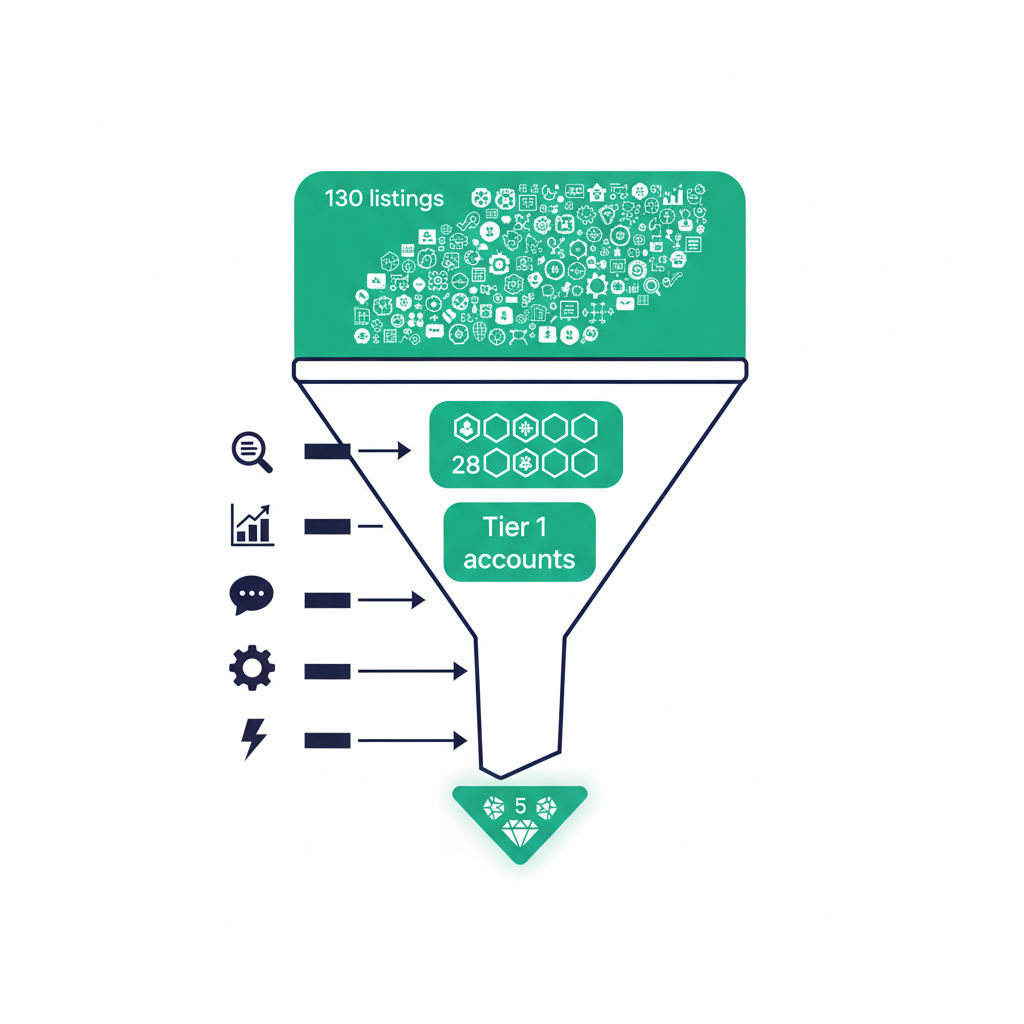
Scoring is where the leverage lives. A list of 130 dentists is not a pipeline. A ranked list where the top 28 have a documented opportunity score, and the top tier are “triple-gap” accounts with sub-4.0 ratings, fewer than 20 reviews, and no functional website, is a pipeline.
Build the score in a spreadsheet. Five factors, for a maximum of 100 points.
The five scoring factors and how to weight them
| Factor | What to measure | Max points |
|---|---|---|
| Review count gap | Prospect’s count vs. local top-3 median | 30 |
| Rating band | 3.2–3.9 = 20 pts; 4.0–4.4 = 10 pts; below 3.2 or above 4.5 = 0 pts | 20 |
| Website tier | No site = 20; brochure-only = 15; slow/non-mobile = 10; functional = 0 | 20 |
| GBP completeness | Missing hours, sparse categories, no photos visible | 15 |
| Estimated Maps rank band | Position 4–10 = 15; 11–20 = 10; 20+ = 5; top 3 = 0 | 15 |
Review count gap gets the heaviest weight because it is the most concrete, quantifiable problem you can solve, and it translates directly into a revenue story. A business with 8 reviews against a local median of 80–100 has a measurable visibility deficit that a prospect can understand without knowing anything about SEO.
To calculate the local top-3 median: for each row in your dataset, find the three highest review counts in the same city and sub-service tag, compute the median, and subtract your prospect’s count. A formula in Google Sheets handles this in seconds once your data is tagged correctly.
Rating bands: which ranges signal high upside vs. high risk
According to BrightLocal’s Local Consumer Review Survey, businesses with 4.0–4.5 star ratings receive the highest consumer trust and click-through rates. That means the 3.2–3.9 band is your sweet spot for upside without catastrophic reputation risk. These businesses have room to improve, fixable problems (recurring complaints about communication or wait times, not fundamental service failures), and a concrete case for a review-generation strategy.
Below 3.2, the reputation risk is high. You can still work with these accounts, but the engagement model shifts from “SEO” to “reputation management first, then SEO,” and your pitch needs to reflect that. Above 4.5, the need for your services is low. These businesses are already winning on reputation; their gaps, if any, are technical or content-related, and the urgency is lower.
Building three tiers to match effort to opportunity
- Tier 1 (score 70–100): personalized micro-audit plus a Loom video. These accounts get your full attention.
- Tier 2 (score 40–69): semi-personalized email sequence. Solid opportunities, but not worth Tier 1 time.
- Tier 3 (score below 40): low-touch nurture or discard.
Flag any account that scores high on multiple deficits simultaneously (sub-4.0 rating, fewer than 15 reviews, and no website) as a “triple-gap” account. These are your highest-priority outreach targets. The ROI case is easiest to quantify and hardest to argue with, because every gap is a concrete deliverable.
Step 5: Run a 5-Minute Micro-Audit on Every Tier 1 Account
Scoring tells you who to prioritize. The micro-audit tells you what to say. Five minutes per account, structured the same way every time, produces the specific talking points that make cold outreach feel like a warm referral.
Checking Maps rank for the primary money keyword
Search “[service] [city]” in Google (not the business name, the service keyword their customers use). Find where the business appears in the Maps results. Businesses in positions 4–20 are the most leverageable: small improvements can move them into the visible local pack and meaningfully increase call and visit volume.
Log the exact position. “You are ranking 7th for ‘dentist Dallas’” is a specific, verifiable claim. “Your rankings could be better” is not.
What to log directly from the Google Business Profile
Open their GBP listing and spend 90 seconds logging five things:
- Photo count. Profiles with sparse or no photos are a named, fixable gap; GBP completeness is consistently cited as a local ranking signal in Moz’s Local Search Ranking Factors research, and photos are one of the most visible completeness signals to a prospect.
- Date of last post. A GBP with no posts in 6+ months signals the owner is not actively managing their profile.
- Services listed. Are specific services named, or just the primary category?
- Booking link. Does one exist? If not, that is a conversion gap.
- Owner responses to reviews. Does the owner respond, and do they sign by name? Engaged owners are better prospects and easier to reach.
Each missing element is a concrete deliverable you can promise, not a vague “we will optimize your profile.”
Website gaps that become specific talking points, not generic claims
Spend 90 seconds on PageSpeed Insights (free, no login) or Google’s mobile-friendliness test. Capture three numbers: mobile performance score, estimated load time, and whether a click-to-call button is visible above the fold on a phone screen.
A dentist’s website that loads slowly on mobile and buries the phone number below the fold is losing patients to the competitor whose site loads fast with a tap-to-call button at the top. Those specific numbers (load time, missing click-to-call) become the opening line of your outreach. Not “your website needs work.” “Your site takes 8 seconds to load on mobile and does not show a call button above the fold; on a phone, that is where most of your patients are looking.”
Also check whether they are running Google Ads for their main service keywords. If they are paying for clicks but ranking poorly in Maps and organic, frame your pitch as reducing their blended customer acquisition cost, not just “getting more traffic.”
Step 6: From Scored Leads to Paying Clients
A scored, audited shortlist is not a pipeline. It becomes one when you find the right person, say the right thing, and follow up the right number of times. Here is the downstream play.
Finding the decision-maker without pitching the front desk
For owner-operated local businesses, the decision-maker is almost always the owner. Three ways to find them without a cold call to the front desk:
- GBP owner responses. Check whether the owner responds to reviews and what name they sign with. “Thanks for the kind words! Dr. Sarah Chen” tells you the owner’s name and that they are personally engaged in their reputation.
- The website’s About page. Most owner-operated service businesses have one, and it usually names the owner.
- LinkedIn filtered by company name and “owner” or “founder” title. Works reliably for businesses with any web presence.
Owners who respond to reviews by name are your best prospects. They are already paying attention to their online reputation, they read customer feedback, and they are more likely to respond to a pitch that leads with visibility data rather than technical SEO jargon.
Building one gap-led outreach asset per Tier 1 account
For each Tier 1 account, build one outreach asset: a 90-second Loom video. The structure is simple:
- 0–20 seconds: show their Maps listing and their current review count and rank position
- 20–50 seconds: pull up the top competitor in their city with 3x their reviews, show the rank difference
- 50–90 seconds: show one specific website gap (the mobile load time, the missing click-to-call, the blank Services section on their GBP)
This is not a full audit. It is a “here is what I found in five minutes” hook. The goal is a reply, not a contract.
The four-touch sequence and how to nurture non-responders
Structure a four-touch sequence over 10–14 days:
- Touch 1 (Day 1): gap-led email with one specific data point in the subject line. “[Business name]: 11 reviews vs. [Competitor]‘s 94” is a subject line that earns an open.
- Touch 2 (Day 3): Loom link with their business name in the subject. “I recorded a quick 90-second video for [Business name]” works because it is specific and low-commitment to watch.
- Touch 3 (Day 7): offer a free 20-minute visibility audit call with a direct calendar link. No pitch; just a specific, time-bounded offer.
- Touch 4 (Day 12–14): breakup email that names a local competitor who fixed the same issue. “I worked with another [city] dentist who had a similar review gap; they went from 12 to 67 reviews in 90 days and moved from position 8 to position 2. Thought it might be relevant.” This creates urgency without fabricating scarcity.
For non-responders after the sequence, move them to a 30-day nurture cadence: one email per month that leads with a new data point (“[Competitor] just crossed 100 reviews”) rather than re-pitching. This keeps you top of mind without burning the relationship.
Systematizing wins into a repeatable ICP for the next city sprint
When you close a client, document the exact gap profile that made them convert: rating band, review count gap, website tier, Maps position, sub-service tag. After three or four wins, patterns emerge. That pattern is your ICP filter for the next city sprint.
After 60 days with a client, capture a before/after snapshot: Maps rank, review count, website speed score. Turn it into a one-page case study that names the niche and city but anonymizes the business. This becomes the “competitor who fixed the same issue” asset in your fourth-touch emails for the next sprint. The prospecting system feeds the case study library, and the case study library makes the next sprint’s outreach more credible.
Worked Example: Dallas Dentists Sprint
All figures below are illustrative assumptions, not researched facts, included to show how the math works.
Assumption A: You run one search (“dentist” in Dallas, TX) and receive 180 unique listings in the CSV export.
Assumption B: After cleaning (removing chains, franchises, and blank-phone rows), 130 independent practices remain.
Assumption C: You apply the five-factor opportunity score using a spreadsheet formula referencing the Rating, Review Count, and Website columns. Scoring takes roughly 2 minutes per row; total cleaning and scoring time: about 5 hours for 130 rows.
Assumption D: 28 practices score 70 or above (Tier 1). Of those, 11 are triple-gap accounts: sub-4.0 rating, fewer than 20 reviews, and no website or a brochure-only site.
Assumption E: You spend 5 minutes per Tier 1 account on the micro-audit (Maps rank check, PageSpeed, GBP photo and post count); 28 accounts × 5 minutes = 2.3 hours.
Assumption F: You record a 90-second Loom for each of the 11 triple-gap accounts; 11 × 15 minutes (setup, record, send) = about 2.75 hours.
Assumption G (conversion rate): Your four-touch sequence converts 2 of the 11 triple-gap accounts into discovery calls. This is an illustrative assumption, not a sourced benchmark.
Assumption H (retainer price): 1 of those 2 closes at a $1,200/month local SEO retainer, a standard entry-level figure for local SEO services.
The math: Total prospecting time for the sprint is roughly 10 hours. One closed client at $1,200/month = $1,200 MRR from roughly 10 hours of prospecting work.
The same 130-row CSV can be re-used for Tier 2 outreach the following month with a lower-touch email sequence, extracting additional value from the same data pull without re-running the search.
The key insight: the leverage is in the scoring filter, not the list size. Concentrating Tier 1 effort on 11 triple-gap accounts is what makes the economics work. Spray-and-pray across all 130 with the same effort dilutes both time and conversion rate.
Frequently Asked Questions
How do I use Google Maps ratings and reviews to find the best local SEO prospects?
Filter for businesses in the 3.2–3.9 star rating band (real customers, meaningful upside) then calculate the review count gap versus the local top-3 competitor median. A business with 8 reviews against a local median of 80 has a concrete, quantifiable problem. Combine both filters to surface accounts where the revenue story is specific and the fix is achievable.
What signals on a Google Business Profile show that a local business needs SEO help?
Six signals are visible before any enrichment: fewer reviews than local competitors, a rating below 4.0 with recurring fixable complaints, no website or a brochure-only site, missing or incomplete business hours, sparse or missing photos, and no recent GBP posts. Three or more simultaneously makes an account a high-priority prospect; each gap is a concrete deliverable you can name in outreach.
What’s the best way to score Google Maps leads by review count and star rating?
Build a five-factor numeric rubric in a spreadsheet. Weight review count gap most heavily (up to 30 points: each prospect’s count vs. the local top-3 median). Add a rating-band score (20 points for the 3.2–3.9 band, 10 for 4.0–4.4, 0 for below 3.2 or above 4.5), then score website tier, GBP completeness, and estimated Maps rank band for the remaining 50 points. Sort descending and concentrate Tier 1 effort on accounts scoring 70 or above.
How can I quickly identify local businesses on Google Maps that don’t have a website?
In any structured Google Maps export, the Website field is blank for businesses without a site. Add a has_website boolean column (1 if populated, 0 if blank) and filter for 0. In our observed exports of independent service businesses across mid-sized cities, roughly 10–25% have no website; these score highest on the website-tier factor and are among the easiest prospects to build a revenue story around.
Which Google Maps data fields matter most for high-intent local SEO outreach?
Rating and review count are the core qualification signals. Website (present or blank) determines the website-tier score. Categories enable sub-service tagging for tailored messaging. Phone (present or blank) signals GBP completeness. Business hours (complete or missing) add another completeness signal. The Google Maps link goes directly into Loom recordings and audit emails. GPS coordinates and business ID matter for deduplication across multi-city pulls.
How do agencies turn a Google Maps export into a qualified local SEO prospect list?
Four steps after the export: (1) clean (standardize phone formats, add a has_website boolean, tag by sub-service, remove chains); (2) score (apply the five-factor rubric and sort descending); (3) audit (spend 5 minutes per Tier 1 account on Maps rank, GBP photo count, and website mobile performance); (4) outreach (build one gap-led Loom per triple-gap account and run a four-touch sequence over 10–14 days with one specific named data point per touch).
Frequently asked questions
- How do I use Google Maps ratings and reviews to find the best local SEO prospects?
- Filter for businesses in the 3.2–3.9 star rating band (real customers, meaningful upside) then calculate the review count gap versus the local top-3 competitor median. A business with 8 reviews against a local median of 80 has a concrete, quantifiable problem. Combine both filters to surface accounts where the revenue story is specific and the fix is achievable.
- What signals on a Google Business Profile show that a local business needs SEO help?
- Six signals are visible before any enrichment: fewer reviews than local competitors, a rating below 4.0 with recurring fixable complaints, no website or a brochure-only site, missing or incomplete business hours, sparse or missing photos, and no recent GBP posts. Three or more simultaneously makes an account a high-priority prospect; each gap is a concrete deliverable you can name in outreach.
- What's the best way to score Google Maps leads by review count and star rating?
- Build a five-factor numeric rubric in a spreadsheet. Weight review count gap most heavily (up to 30 points: each prospect's count vs. the local top-3 median). Add a rating-band score (20 points for the 3.2–3.9 band, 10 for 4.0–4.4, 0 for below 3.2 or above 4.5), then score website tier, GBP completeness, and estimated Maps rank band for the remaining 50 points. Sort descending and concentrate Tier 1 effort on accounts scoring 70 or above.
- How can I quickly identify local businesses on Google Maps that don't have a website?
- In any structured Google Maps export, the Website field is blank for businesses without a site. Add a has_website boolean column (1 if populated, 0 if blank) and filter for 0. In our observed exports of independent service businesses across mid-sized cities, roughly 10–25% have no website; these score highest on the website-tier factor and are among the easiest prospects to build a revenue story around.
- Which Google Maps data fields matter most for high-intent local SEO outreach?
- Rating and review count are the core qualification signals. Website (present or blank) determines the website-tier score. Categories enable sub-service tagging for tailored messaging. Phone (present or blank) signals GBP completeness. Business hours (complete or missing) add another completeness signal. The Google Maps link goes directly into Loom recordings and audit emails. GPS coordinates and business ID matter for deduplication across multi-city pulls.
- How do agencies turn a Google Maps export into a qualified local SEO prospect list?
- Four steps after the export: (1) clean (standardize phone formats, add a has_website boolean, tag by sub-service, remove chains); (2) score (apply the five-factor rubric and sort descending); (3) audit (spend 5 minutes per Tier 1 account on Maps rank, GBP photo count, and website mobile performance); (4) outreach (build one gap-led Loom per triple-gap account and run a four-touch sequence over 10–14 days with one specific named data point per touch).
Keep learning: guides & glossary · use cases · lead lists by city